A Guide to Using Weather Models
Written by Gavin White
Last updated 11/1/2023, 3:30:37 PM
Weather models are predictive computer outputs that meteorologists use to help forecast the weather. Any weather model has dozens of variables a forecaster may wish to look at, ranging from temperature and humidity to precipitation, wind, and other indices.
Interestingly, the world's most powerful supercomputers are dedicated to running and maintaining the many different weather models. These computers run the models on a set basis; some are run every hour and others every six hours. Some models are built for short-term forecasting, leading to more frequent runs, while others are designed for long-term prediction, leading to infrequent runs.
To use a forecast model, you need to know which one to choose from first. Let’s explore the three models you can explore with WeatherTAP!
[Click Here For an Accompanying Video Guide]
RAP
The Rapid Refresh model is a National Oceanic and Atmospheric Administration (NOAA) model designed to cover North America. The model is updated hourly and uses the most current conditions to initialize each model run. The RAP is most beneficial for short-range forecasting since it models up to 21 hours past the run time.
NAM
The North American Mesoscale Forecast System is operated by a subsidiary of NOAA, also designed for North America (as the name implies). The model is updated every six hours. The NAM outputs results for the next 84 hours (2.5 days), making it a good choice for medium-range forecasts.
GFS
The Global Forecast System is the crown jewel of NOAA’s weather models as it covers the entire globe. Like the NAM, the GFS is updated every six hours, however, its resolution (or level of detail) is significantly lower than the other models.
The GFS is a good choice to get a general idea for long-range forecasting, as each run models 16 days into the future.
Once you’ve decided which model is best suited for your decided timescale, you can choose which variable(s) to look at. There are dozens of options to choose from, but don’t fret as they each have a purpose!

Wind & Height
This section of options visualizes wind speed and direction at various pressure levels. Pressure levels are measured in millibars (MB) and are inversely correlated with height, so the closer to 1000 MB, the closer to the surface of the earth that data is. The other pressure levels are useful for identifying where areas of high and low pressure are or to evaluate troughs and ridges in the jet stream (example pictured below).

Temperature, Relative Humidity, and Dewpoint
The temperature, humidity, and dewpoint outputs visualize forecasted temperatures, humidities, and dewpoints (the temperature at which air holds 100% humidity) at the desired pressure level.
Precipitation
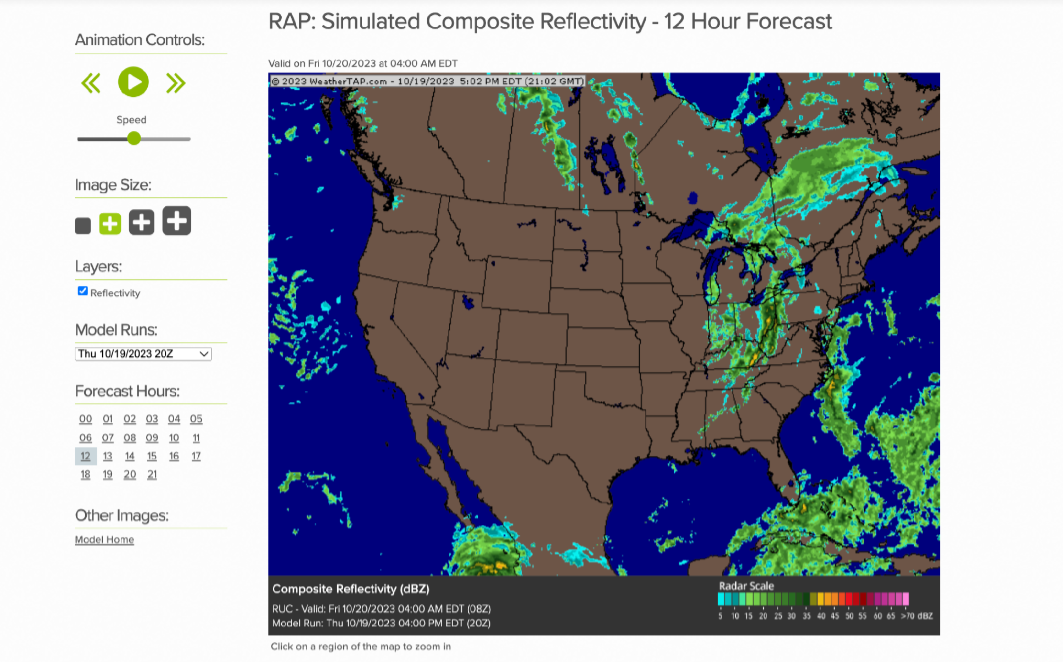
Precipitable Water is a measure of the amount of moisture in the atmosphere that could theoretically be converted into rainfall. Precipitation Accumulation visualizes the amount of rainfall the model thinks will fall over the forecasted period. The winter version of this is Snow Depth. Composite Reflectivity, arguably the most widely used of all the model products, is a simulation of the future radar, visualizing where the model thinks precipitation will occur.

Severe Indices
The severe indices are the most advanced products that each model is capable of producing. CAPE, or convective available potential energy, is essentially the juice needed to power thunderstorms. CIN is often referred to as the “strength of the cap,” which is another measure of thunderstorm potential. These, as well as the other indices, are useful when forecasting for more severe weather.
Now that you know which models you can choose from, and which variables may be applicable to your case, you need to be able to utilize the controls at your disposal! In the image below, a composite reflectivity from the NAM, shows the available controls in the left hand column. At the top is animation controls to watch the model proceed through all available “steps,” or hours after the selected run time of the model. Below that are controls for the image size (pro tip: you can click on the map to zoom in to a closer region).
Additionally, some variables have additional layers that can be toggled to overlay. Finally, model runs and forecast hours allow you to select the run time and various steps associated with the run for viewing.

Now you’re able to utilize weather models on WeatherTAP! Keep in mind that these are models which are imperfect representations of what may occur. Check out other guides on WeatherTAP for details pertaining to other products and tools available to help you with your weather needs!