Understanding SPC Severe Weather Outlooks: How to Read the Colors, Risks, and Storm Threat Maps
Written by Sarrah Pelorus, Megan Ironside
Last updated 8/12/2026, 9:33:26 AM
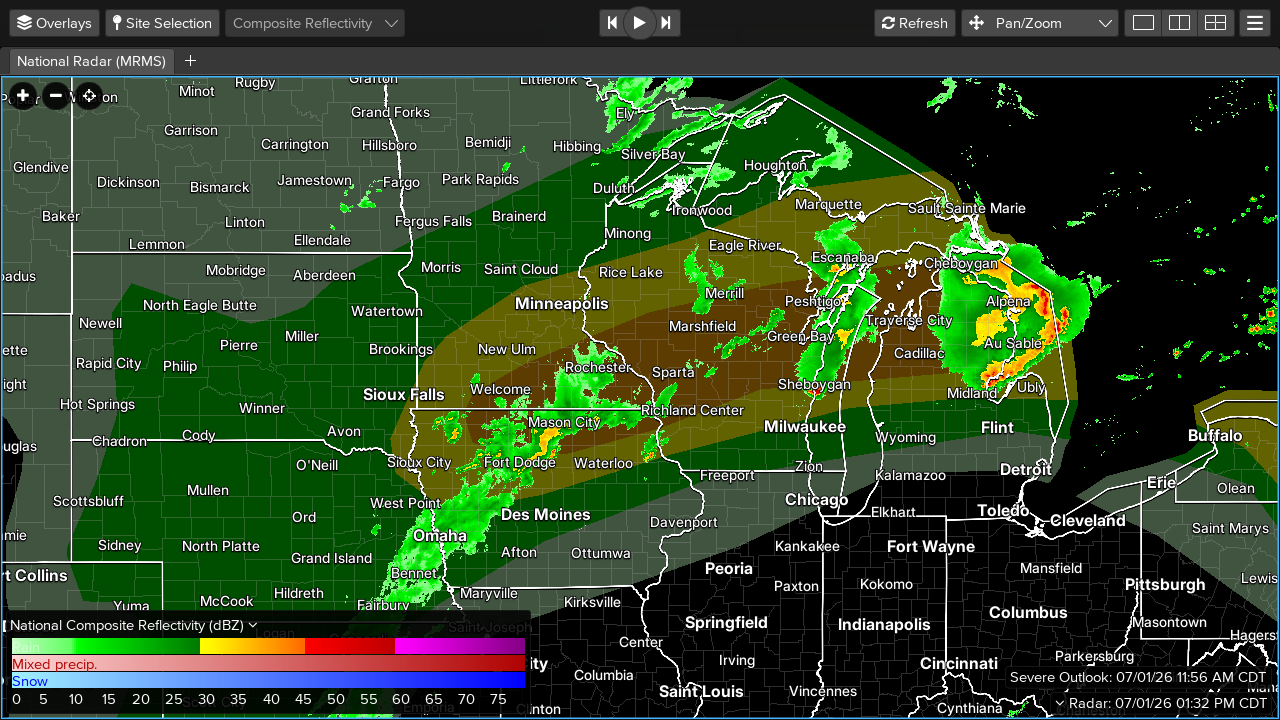
WeatherTAP is excited to announce support for the Storm Prediction Center's newly enhanced severe weather outlooks. These updated graphics build on the familiar Marginal, Slight, Enhanced, Moderate, and High Risk categories by adding valuable information about storm intensity, giving users a clearer understanding of the threats that may develop. Whether you're an emergency manager, storm spotter, pilot, or simply someone who wants to stay weather-aware, these new outlooks can provide another powerful tool to help you prepare before severe weather strikes.
What is an SPC Convective Outlook?
A Storm Prediction Center (SPC) Convective Outlook is a forecast map showing the potential for severe thunderstorms across the United States.
The SPC issues outlooks for multiple time periods, but the most commonly viewed are:
- Day 1 Outlook: Today through tonight
- Day 2 Outlook: Tomorrow
- Day 3 Outlook: The following day
These forecasts use computer models, radar trends, satellite data, atmospheric measurements, and meteorologist analysis to determine where severe storms may develop.
A severe thunderstorm typically means a storm capable of producing:
- Wind gusts of 58 mph or greater
- Hail one inch or larger
- Tornadoes
Conditional Intensity Groups
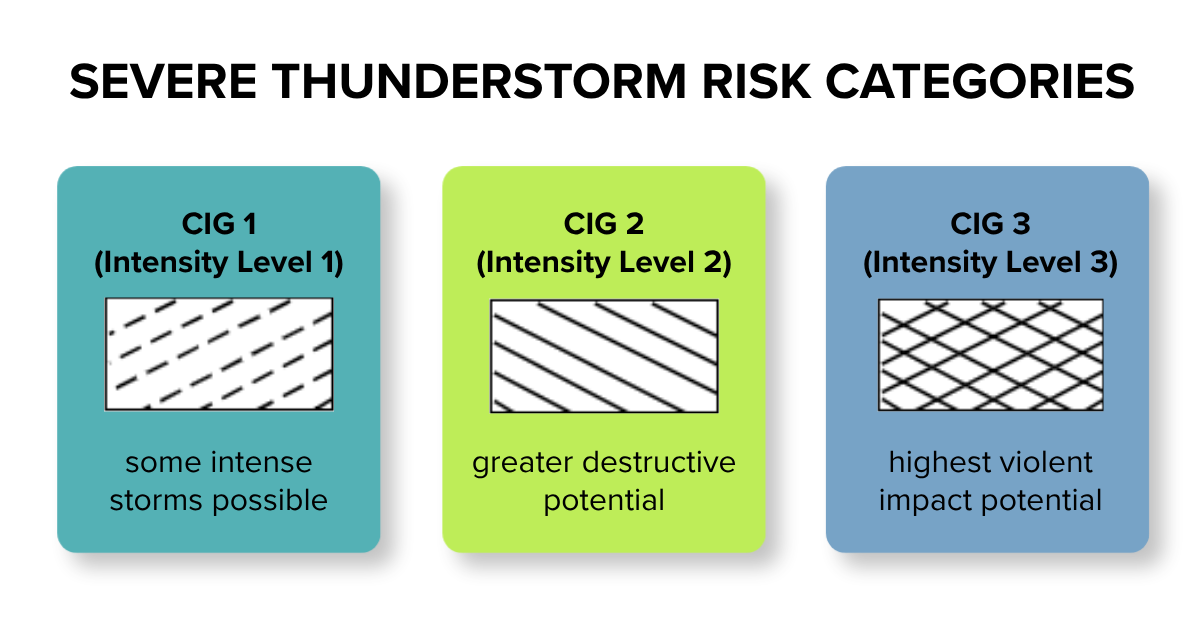
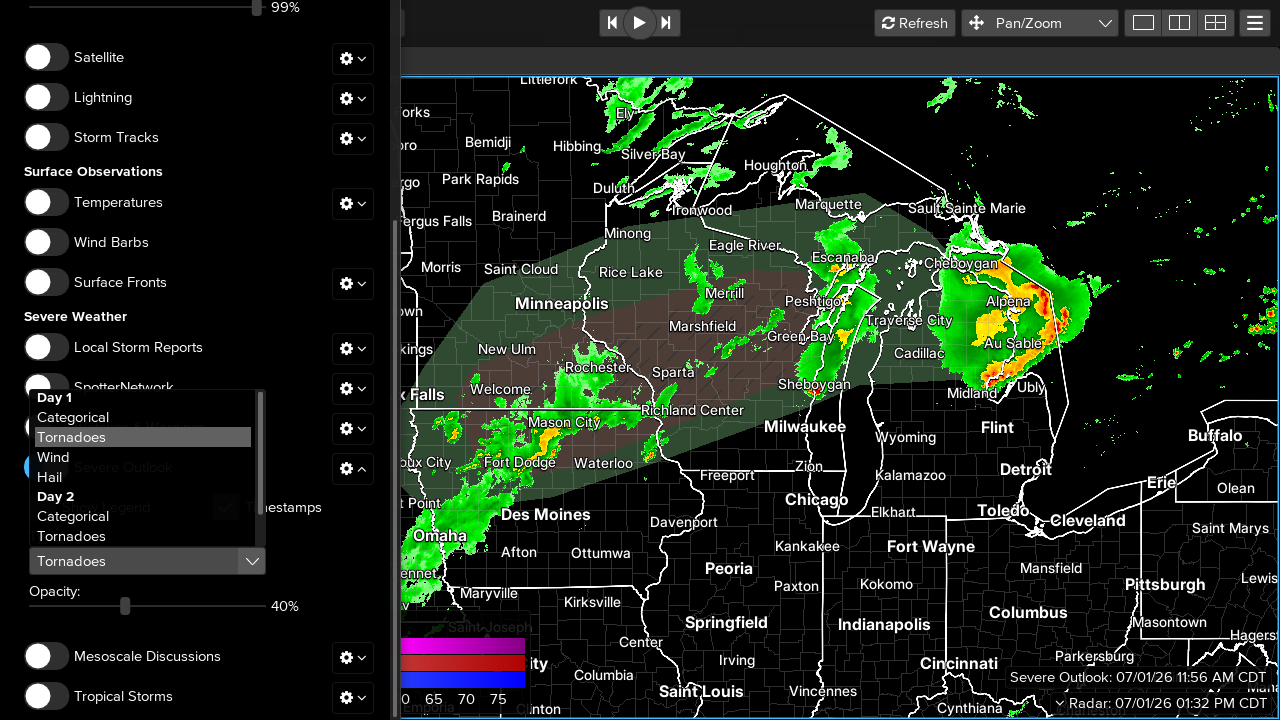
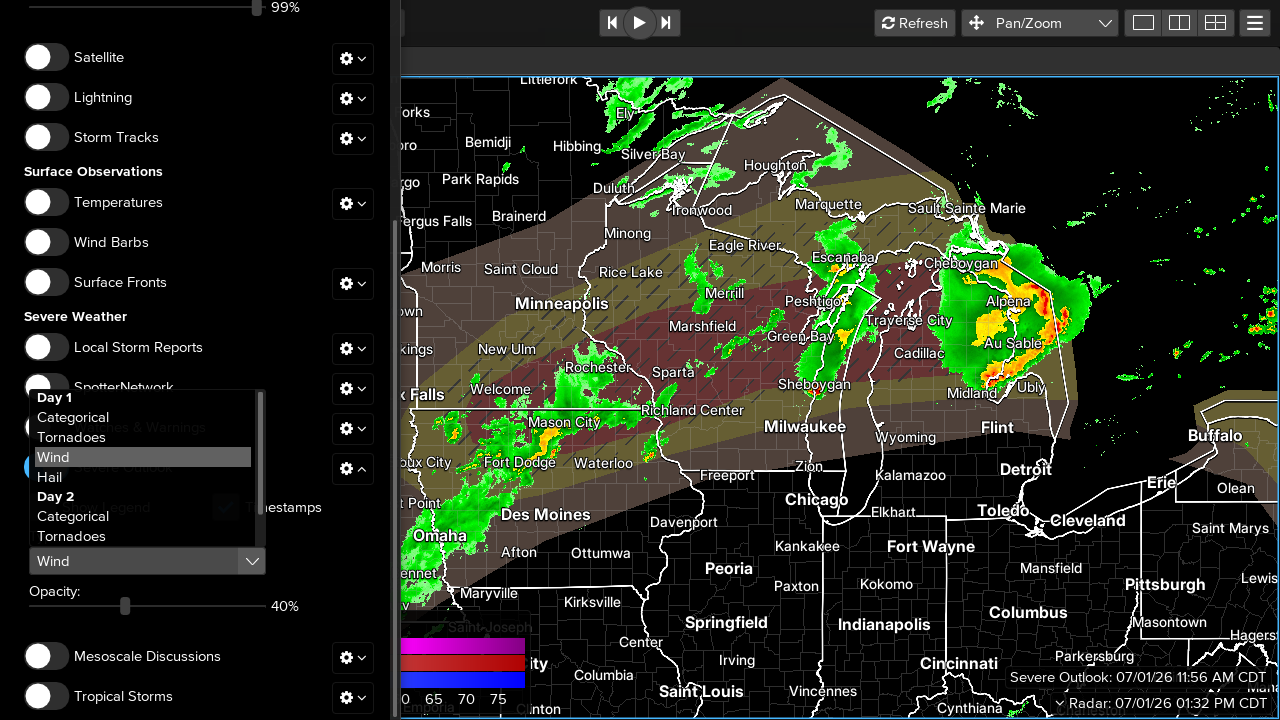
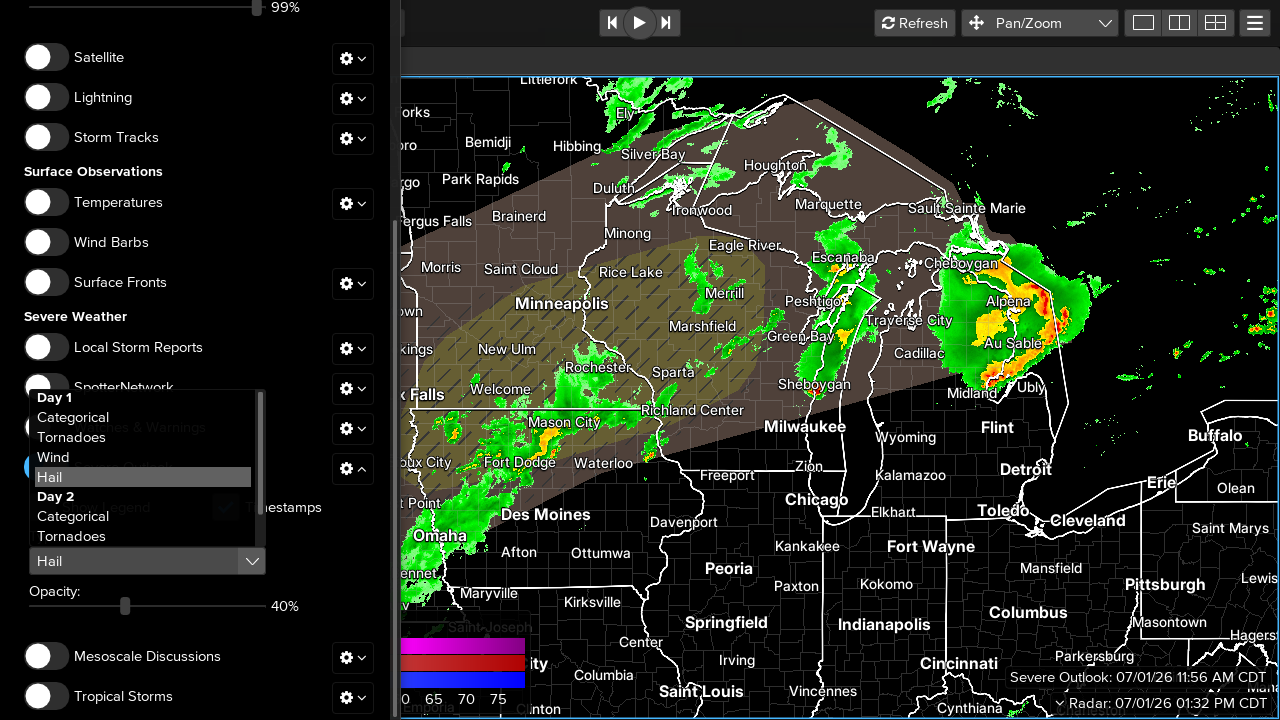
When you view the individual Tornado, Wind, and Hail outlook layers in RadarLab, you will now see graduated intensity tiers instead of a generic hatched area. Here is what those CIG tiers translate to for each specific threat:
Individual Tornado Outlook
Base Risk: Standard severe setup. Potential for weak, brief, or isolated tornadoes (EF0–EF1).
CIG1 (Tier 1): Lower-end significant tornado environment (potential for EF2–EF3).
CIG2 (Tier 2): Strong to violent tornado potential, often associated with intense, long-track supercells.
CIG3 (Tier 3): Reserved for extreme, historic setups capable of producing violent, destructive EF4+ tornadoes.
Individual Damaging Wind Outlook
CIG1 (Tier 1): Scattered damaging gusts (58 to 74 mph).
CIG2 (Tier 2): Intense, organized severe wind systems, like robust squall lines or standard derechoes (75 to 85+ mph gusts).
CIG3 (Tier 3): High-end, historic derecho complexes producing hurricane-force winds (90+ mph) capable of widespread grid damage.
Individual Large Hail Outlook
CIG1 (Tier 1): Large to very large hail (1.5 to 2.5 inches / ping pong to tennis ball size).
CIG2 (Tier 2): Giant, destructive hail (3.0 to 4.0+ inches / baseball to grapefruit size), typically spawned by deeply intense, isolated supercells.
Understanding the SPC Risk Categories
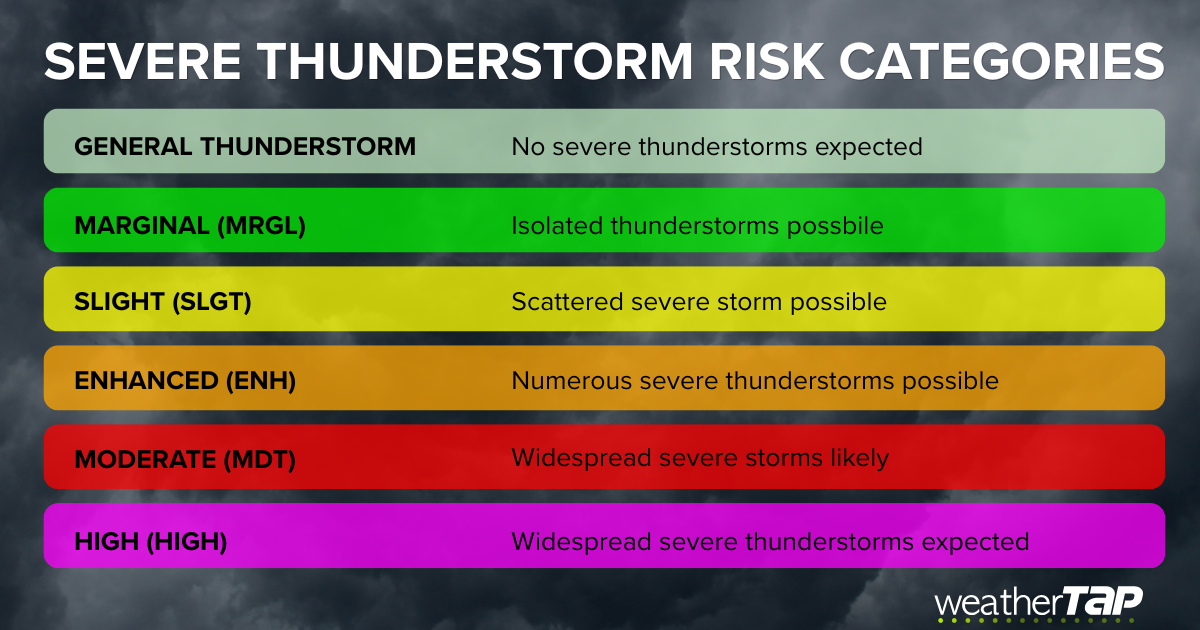
The SPC uses five main categories to communicate the overall severe weather threat. The colors are designed to show increasing levels of concern, from isolated severe storms to widespread, dangerous outbreaks.
Marginal Risk (Level 1 of 5)
A Marginal Risk means isolated severe thunderstorms are possible.
Storms may be limited in coverage, duration, or organization, but a few storms could still produce:
- Strong wind gusts
- Small amounts of severe hail
- An isolated tornado
A Marginal Risk does not mean storms cannot be dangerous. It means severe weather is expected to be more limited compared to higher categories.
Slight Risk (Level 2 of 5)
A Slight Risk means organized severe thunderstorms are expected, but they may be scattered or inconsistent across the risk area.
This is one of the most common SPC categories and is often misunderstood because the word “slight” sounds less concerning.
However, Slight Risk days can still produce:
- Damaging winds
- Large hail
- A few tornadoes
- Strong thunderstorms affecting communities
The SPC notes that a Slight Risk indicates organized severe thunderstorms are possible, even if widespread severe weather is not expected.
Enhanced Risk (Level 3 of 5)
An Enhanced Risk means a greater concentration of severe storms is expected.
Storms are more likely to become organized and may produce stronger impacts, including:
- Numerous damaging wind reports
- Larger hail
- A higher tornado threat
People within an Enhanced Risk area should have multiple ways to receive weather warnings and be prepared for rapidly changing conditions.
Moderate Risk (Level 4 of 5)
A Moderate Risk signals the potential for a significant severe weather event.
This category suggests forecasters expect widespread severe storms with the possibility of:
- Numerous severe thunderstorms
- Strong tornadoes
- Widespread damaging winds
- Significant impacts over a large area
Moderate Risk days are much less common than Slight or Enhanced Risk days and often receive increased attention from emergency officials and meteorologists.
High Risk (Level 5 of 5)
A High Risk is the most serious SPC category and is reserved for rare, extreme severe weather outbreaks.
High Risk events may include:
- Numerous intense tornadoes
- Long-track tornadoes
- Widespread destructive winds
- Major severe weather outbreaks
High Risk outlooks are uncommon, typically occurring only a few times per year.
Why the Percentage Matters
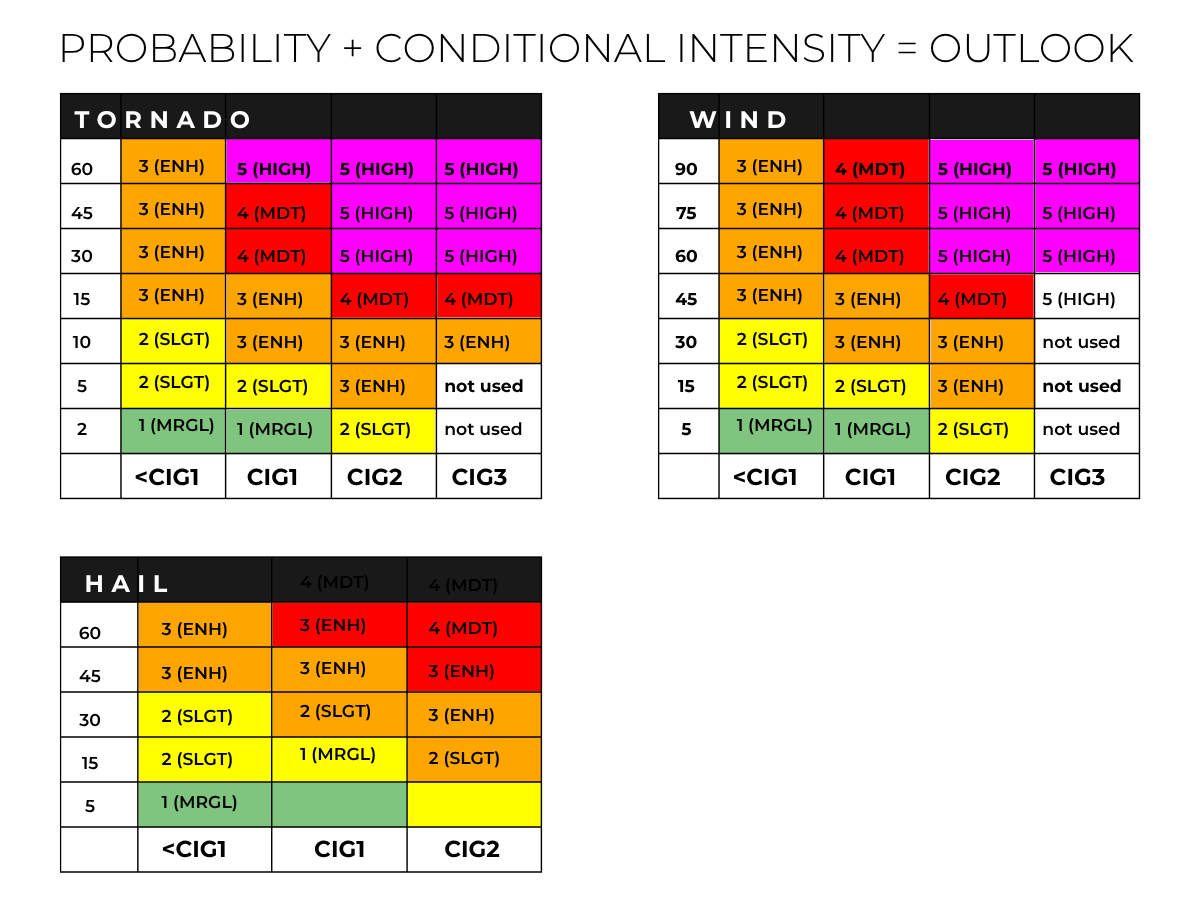
Beyond the colored risk areas, the SPC also provides probability maps showing the chance of specific hazards occurring.
These include:
- Tornado probability
- Damaging wind probability
- Large hail probability
These percentages represent the chance of that hazard occurring within approximately 25 miles of a given location.
For example: A 15% tornado probability may not sound high, but in weather forecasting terms, that is a significant risk. Tornado probabilities are usually much lower than wind or hail probabilities because tornadoes are much less common.
Tornado, Wind, and Hail Maps: Why They Matter
A severe weather outlook is only part of the story. The SPC also breaks down the specific threats:
Tornado Threat Maps
These maps show where tornado development is most likely.
A lower tornado probability does not always mean a weak storm threat. A small number of storms can still produce intense tornadoes if atmospheric conditions are favorable.
Damaging Wind Maps
Wind threats are often more widespread than tornado threats because thunderstorms can produce damaging straight-line winds across large areas.
These threats may come from:
- Bowing lines of storms
- Squall lines
- Downbursts
Hail Maps
Large hail can occur even when tornado potential is low.
Hail threats depend on storm strength, instability, and the ability of a storm to maintain powerful updrafts.
The New Ways to Understand Storm Intensity
Modern severe weather forecasting is adding more detail to help explain not only where storms may happen, but also how intense they could become.
Traditional SPC risk categories focus heavily on the expected coverage of severe storms. Newer forecast tools add information about the potential intensity of storms if they develop.
These additional map details can help show that even an area with a smaller overall probability may still have the potential for a significant storm impact.
For example, an isolated storm may be unlikely, but if it develops in an environment capable of producing strong tornadoes, that threat remains important.
Outlook vs. Watch vs. Warning: Know the Difference
One of the most important things to understand is that an SPC Outlook is not a warning.
Outlook: A forecast indicating where severe weather may develop.
Watch: Conditions are favorable for severe storms. Be prepared to act.
Warning: Severe weather is occurring or imminent. Take action immediately.
Stay Ahead of Severe Weather with WeatherTAP
Severe weather can change quickly. Knowing how to read SPC outlooks gives you an advantage before storms arrive.
Whether you are monitoring storms for emergency response, business operations, weather awareness, or personal safety, weatherTAP provides the tools needed to stay informed.
From radar analysis to severe weather monitoring, weatherTAP can help prepare you for not just where the storms are, but what they may become.
You can access the new outlook maps at the Severe Weather Center and RadarLab X.